bspmview
Quick Links
About
bspmview is a graphical user interface for overlaying, thresholding, and visualizing 3D statistical neuroimages in MATLAB. It requires a number of core functions from the MATLAB software Statistical Parametric Mapping. It has been tested on SPM8+. bspmview was directly inspired by and in some cases incorporates code from from two other statistical image viewers: xjview and FIVE. The idea behind bspmview was to integrate and improve some of the great features of these two viewing programs in an interface that I find to be more intuitive, accessible, and customizable. Most importantly, all of its features require no additional third-party software (other than SPM, of course). Note that some features in bspmview will be automatically disabled if you load in a statistical image that was generated outside of SPM (for instance, in FSL), or if bspmview is unable to locate the model output files (e.g., SPM.mat, ResMS.nii) associated with the provided statistical image.
Features
- reads .img/.hdr, .nii, and .nii.gz
- can read non-statistical/non-intensity images (e.g., binary mask, ROIs, or count images)
- quickly switch display of contrast sign (+, -, or +/-)
- voxelvise and cluster-base uncorrected and corrected image thresholding
- automatic anatomical labeling with the Anatomy Toolbox or Harvard Oxford atlases
- generate interactive table of labeled activation peaks, and save possibly publication-worthy tables to CSV
- customizable and possibly publication-worthy surface renderings
- customizable and possibly publication-worthy slice montages
- save thresholded whole-brain maps or specific clusters as either intensity images or binary masks
- save region-of-interest images by growing spheres/boxes around a coordinate (and optionally intersect the sphere/box with thresholded overlay image)
- customizable color maps (different maps, set max/min, reverse)
- automatically open Neurosynthin browser to examine connectivity/coactivation maps for current coordinate
- and many other random features…
Installation
- Download the software
- Put the bspmview folder either on your MATLAB path or in the “toolboxes” subfolder of your SPM installation. Note that only the parent folder needs to be on the path. The subfolder “supportfiles” is added to the MATLAB path whenever you run bspmview.
Launching bspmview
If you put bspmview in the “toolboxes” subfolder of your SPM installation, you will be able to launch bspmview by selecting it from the “Toolbox:” dropdown menu in the SPM graphical user interface. Otherwise, as long as bspmview is on your MATLAB path you can start it from the command line by entering:
>> bspmview
This will open a file selection dialogue window with which you can select the overlay image you’d like to display:
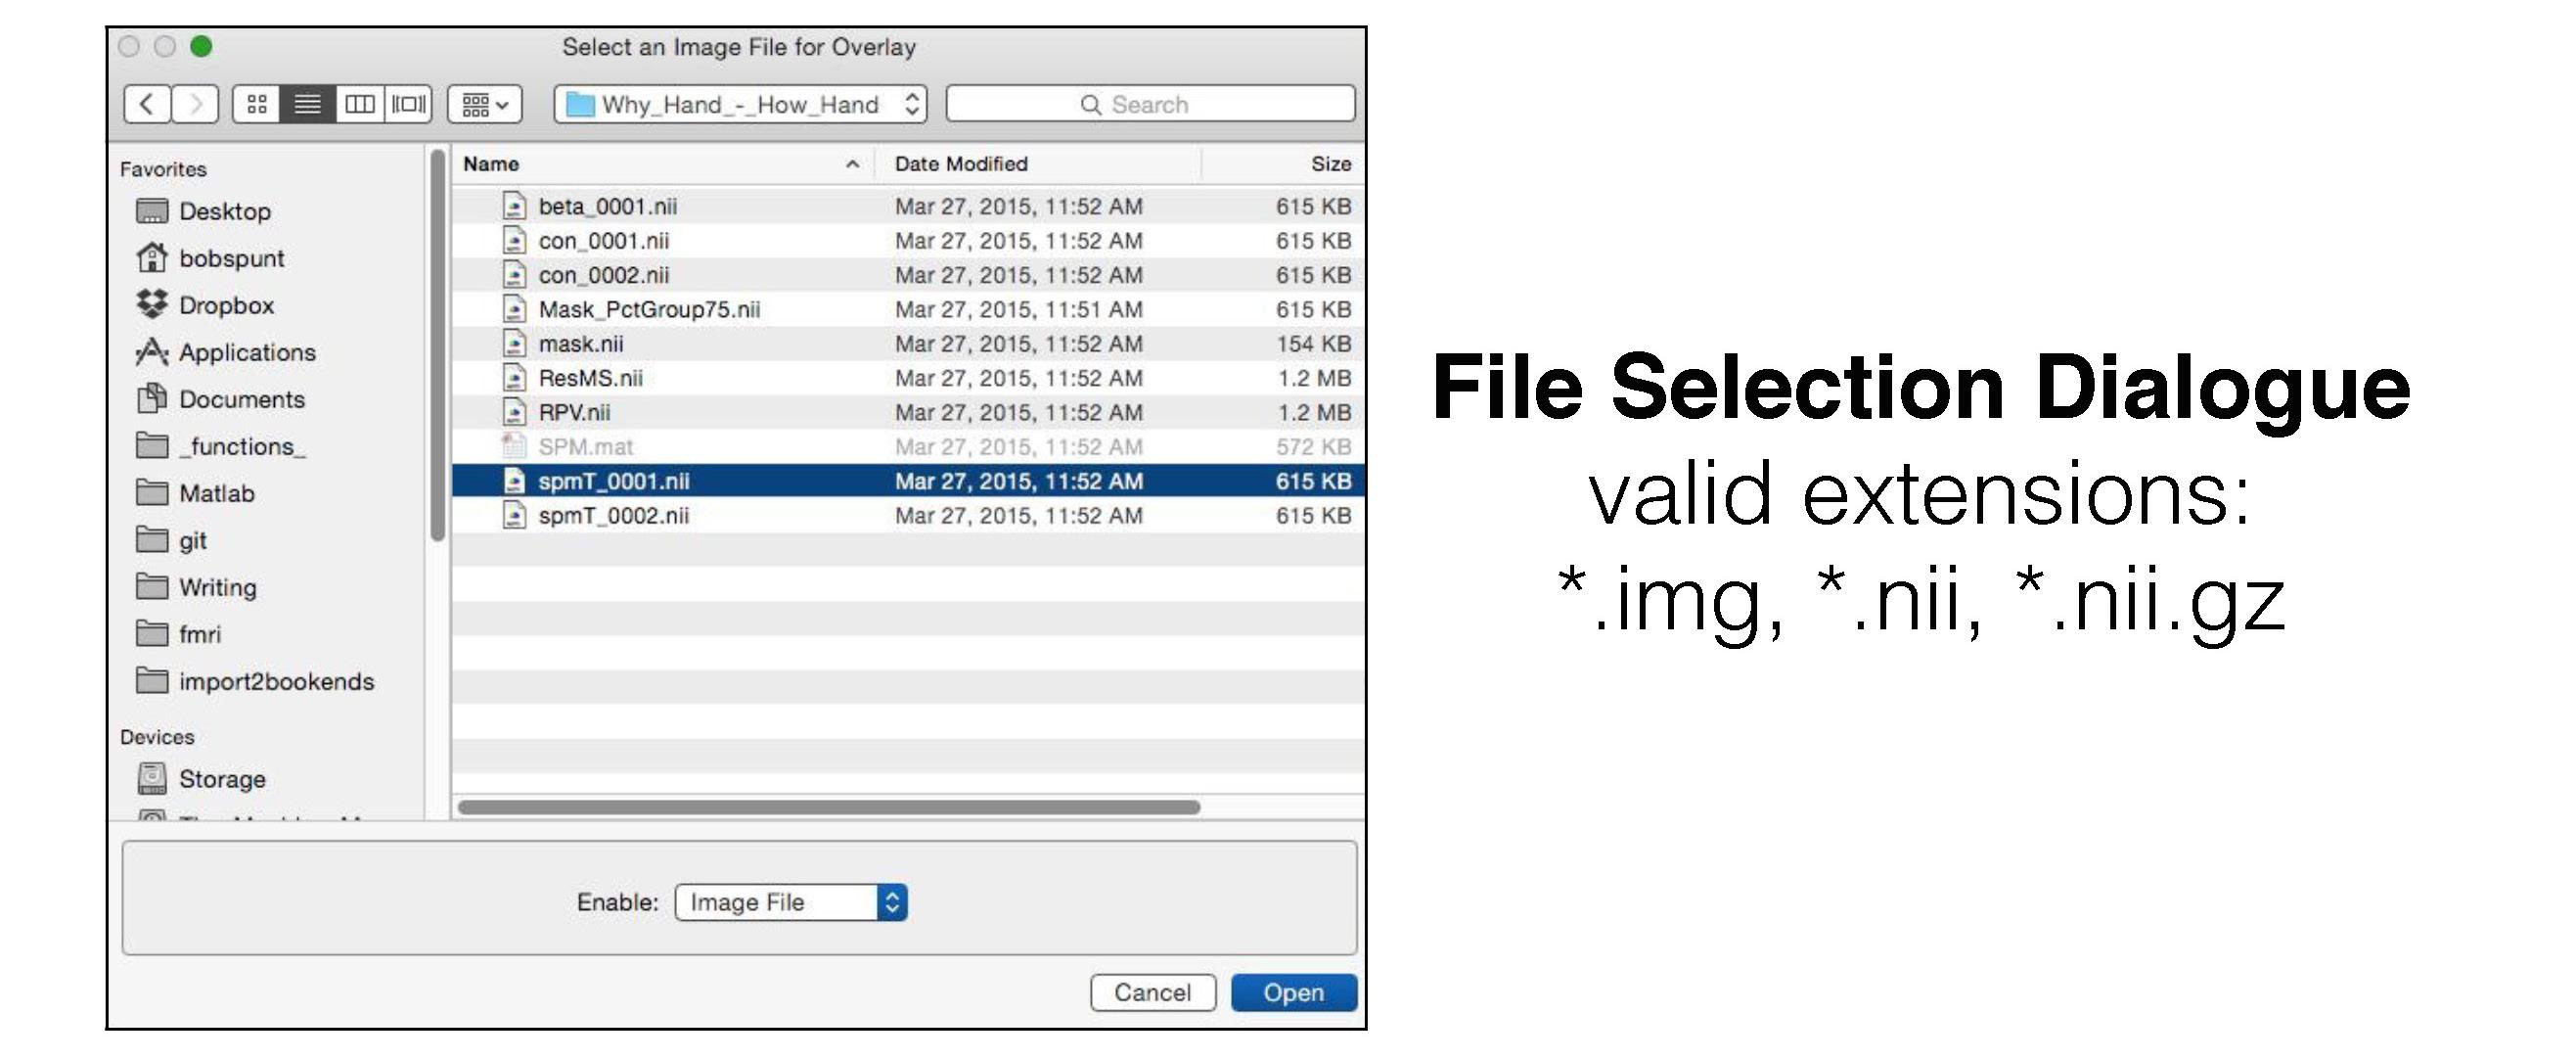
You can also give bspmview filenames for overlay and underlay images as arguments. The following will display the overlay spmT_0001.img on the default underlay (this example assumes that the image is in your working directory; otherwise, you’d need to enter the full path):
>> bspmview('spmT_0001.img')
This will overlay spmT_0001.img on to T1.nii:
>> bspmview('spmT_0001.img', 'T1.nii')
The Main Interface
Once bspmview has launched you should see something that approximates this:
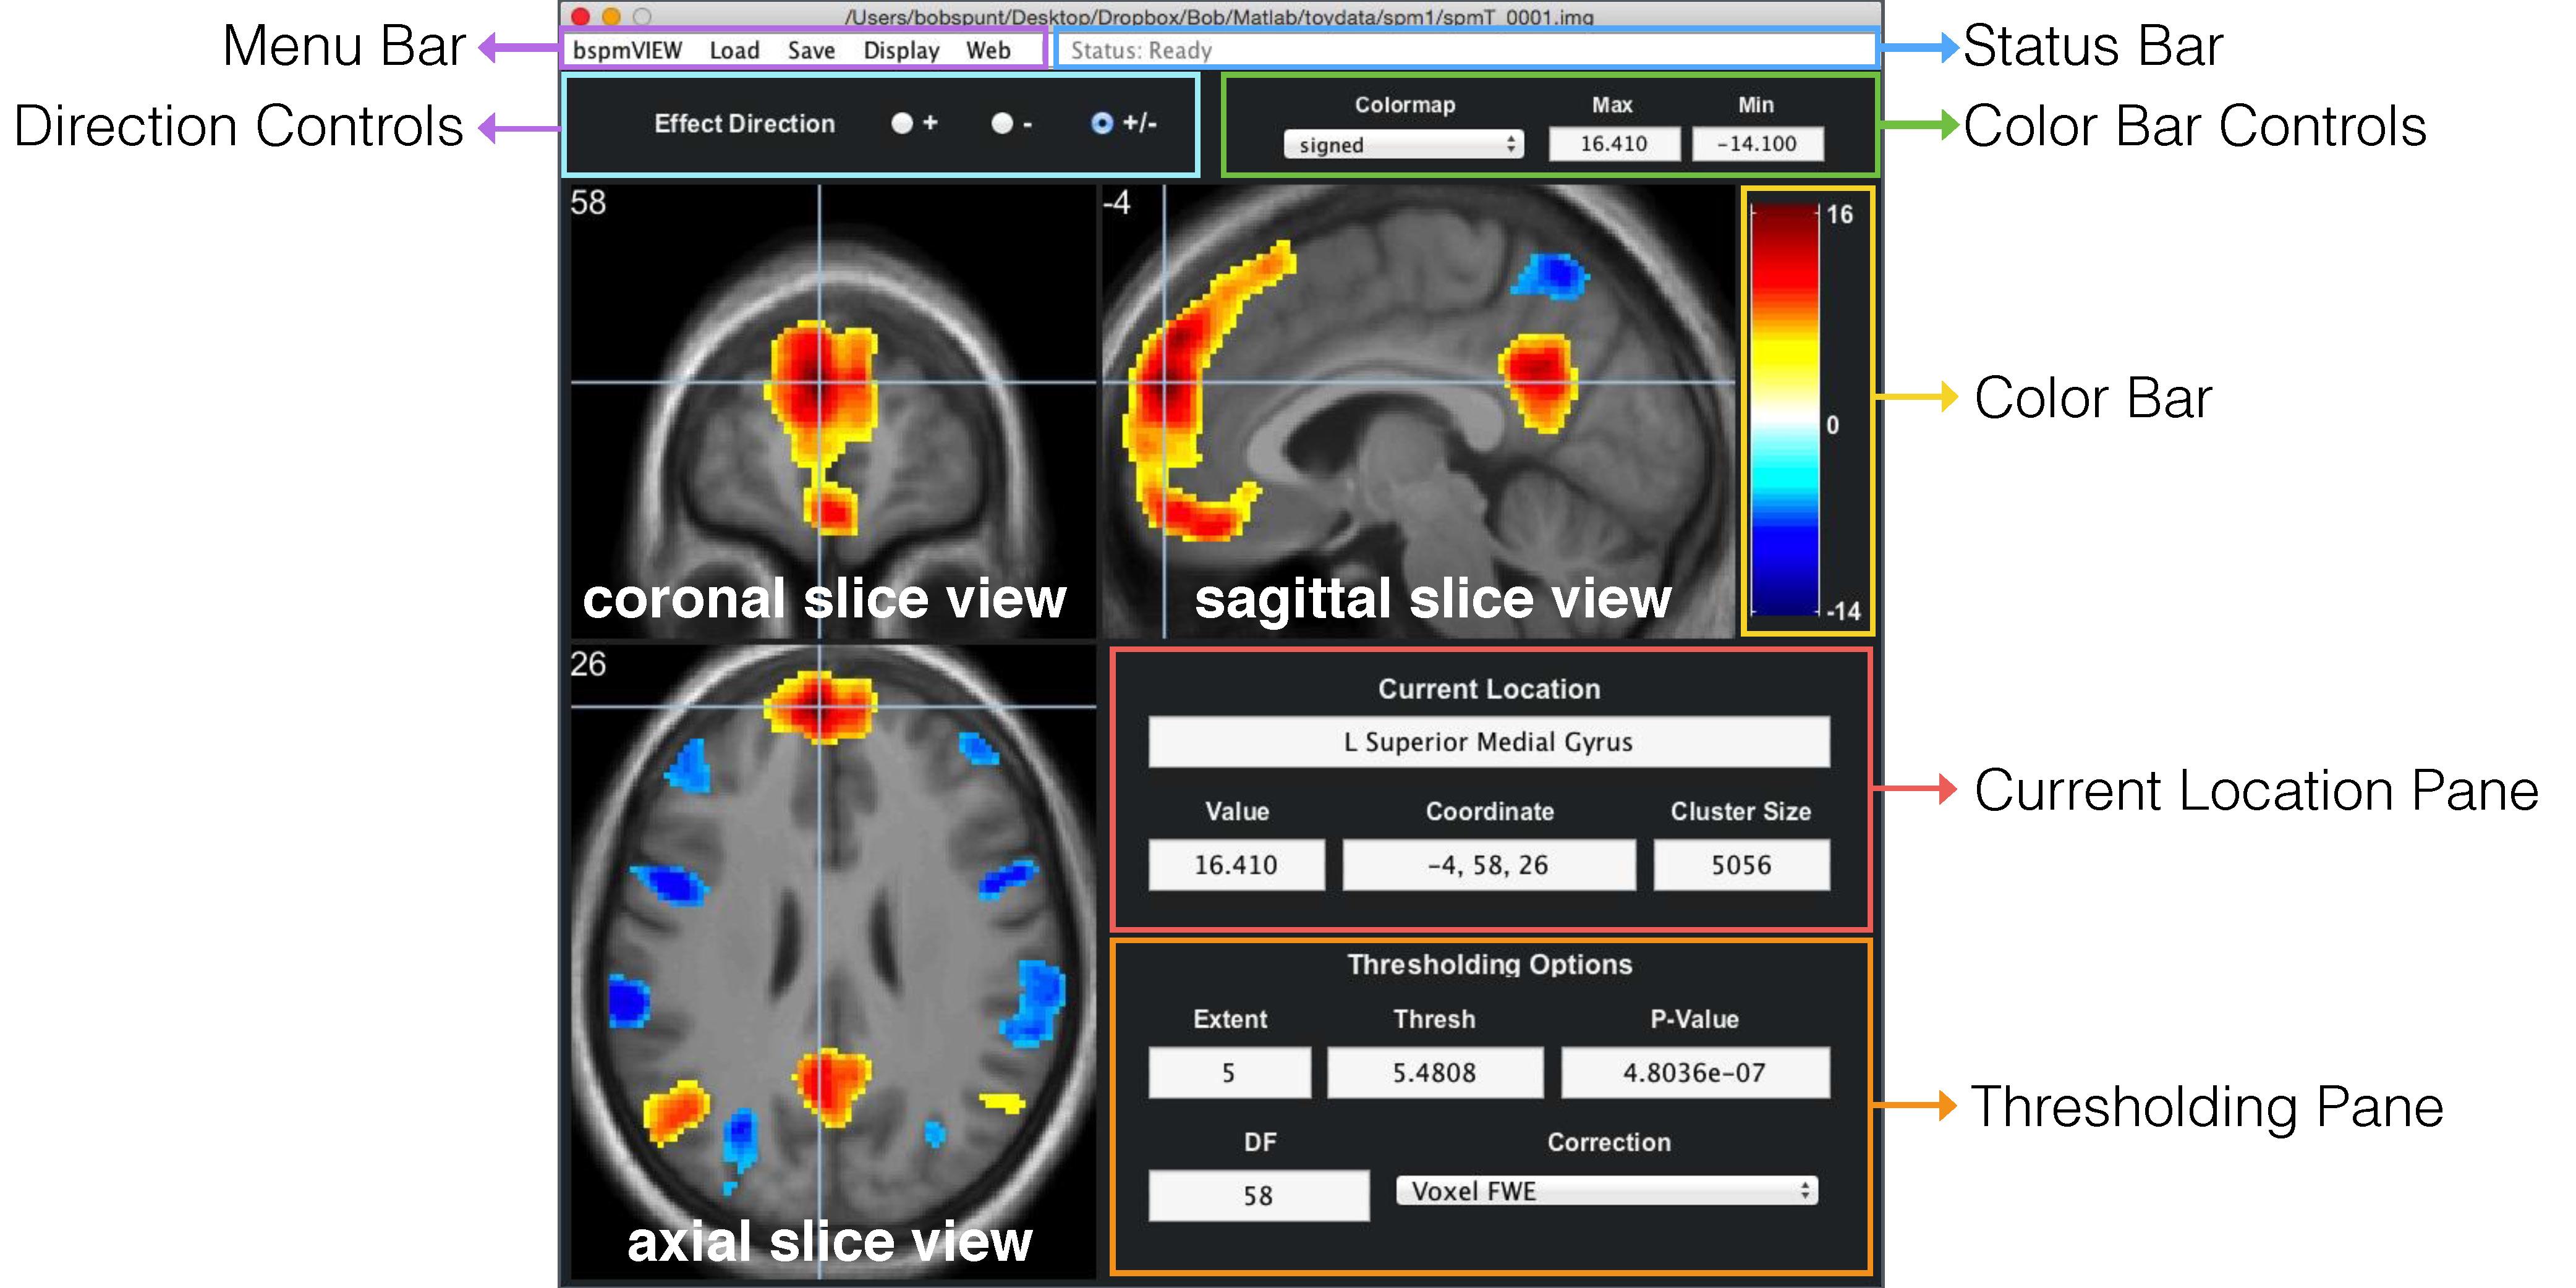
Explore the interface. Click on stuff. Change values and see what happens. Try right clicking on one of the slice views and you should something like this:
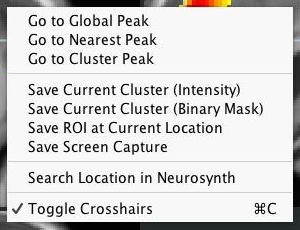
Try selecting Save ROI at Current Location and a menu window should pop up:
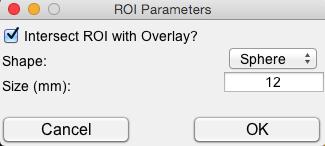
Whoa! Spheres AND Boxes? Customizable sizes? And what’s this? I have the option to intersect my Sphere or Box with the currently displayed (i.e., thresholded) overlay!
Changing the Interface Appearance
If the interface looks wonky (e.g., font sizes are too small) or if you just want to mess with the way it looks, you can do so from from the leftmost menubar entitled bspmview. For instance, you increase or decrease the size of the GUI window, or you can scale the font size of all text in the interface either up or down:
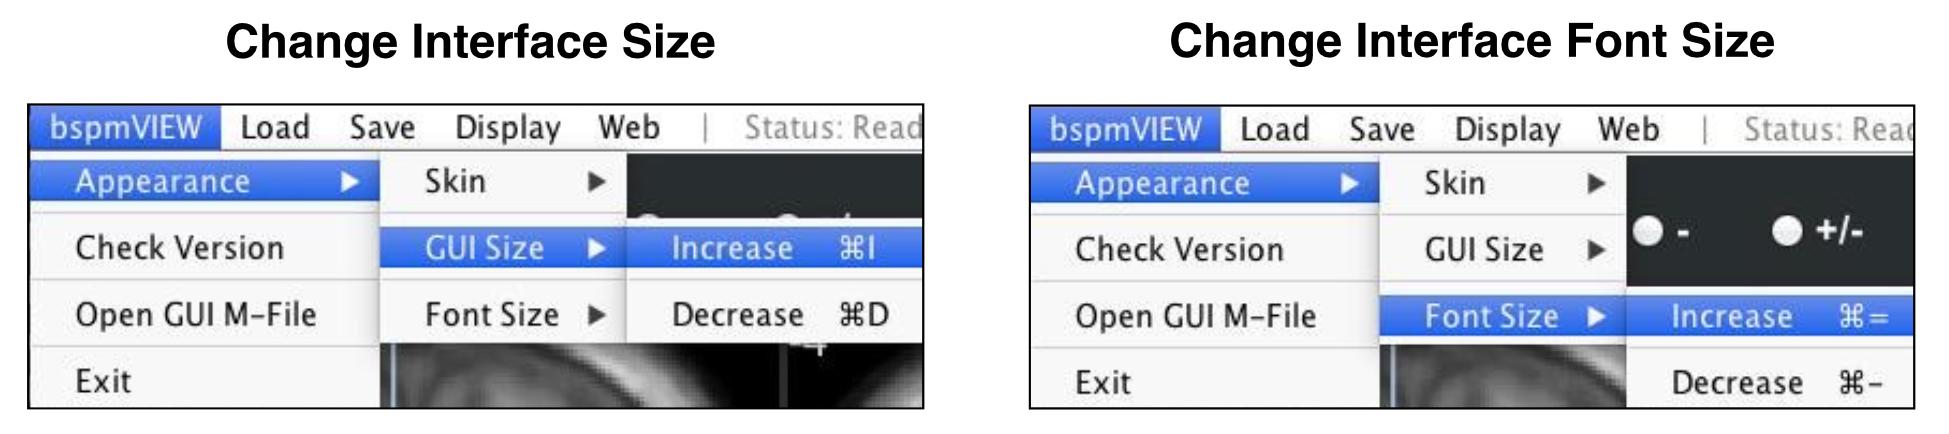
Note the shortcut keys (called “accelerators” in MATLAB), which are displayed for Mac OS X here but should appear with “Ctrl” in place of the “Command” key (e.g., Ctrl=+ should increase font size).
Customizing Preferences
Given that most of the bspmview functionality should be self-explanatory (and given that I have to get back to my real job!), I’ll end the documentation for now by explaining the fields of the Display Preferences menu, which you can find under Display in the Menu Bar:
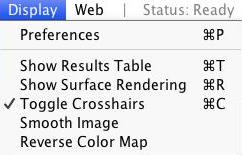
This should bring up a menu that looks like this:
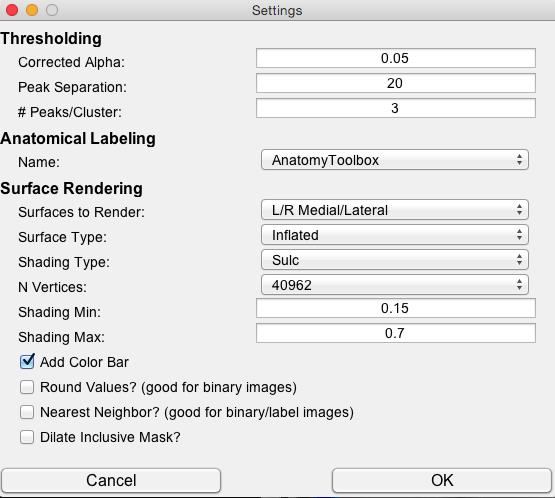
These preferences allow you to customize a number of display features included in bspmview. Modified preferences are saved and reloaded the next time you use bspmview. Under Thresholding you can modify:
- Corrected Alpha: This controls the corrected alpha to use when doing family-wise error correction
Under Thresholding you can also modify two parameters that control how many peaks (local maxima) are identified in the currently thresholded overlay. This will primarily affect the results tables, which display all local maxima. But it will also affect where the crosshair goes when you select Go to Nearest Peak from one of the slice view menus. The parameters are:
- Peak Separation: This is the minimim distance (in mm) separating the peaks. The larger the distance, the fewer the peaks. You may know this by the *Dis variable in the SPM software.
- # Peaks/Cluster: This is the maximum number of peaks to identify per cluster. The smaller the number, the fewer the peaks. You may know this by the Num variable in the SPM software.
Under Anatomical Labeling you can modify:
- Name: This is the Atlas to grab the labels from (currently the Anatomy Toolbox and Harvard-Oxford are the only two preloaded into bspmview)
Under Surface Rendering you can modify parameters that control how your surface renderings will look. Most of the parameters correspond to those present in SurfPlot by Aaron P. Schultz, which is the function upon which this feature is based:
- Surfaces to Render: This controls which of the four views to show (L=Left, R=Right). For instance, the default L/R Medial/Lateral will show:
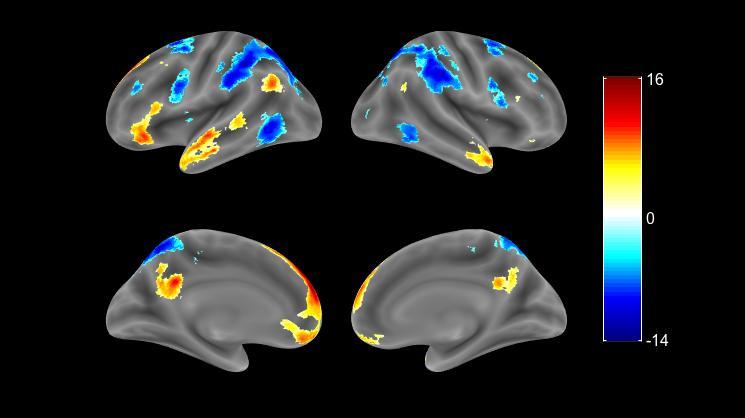
- Surface Type: This controls the type of surface to render on. The above was created using the Inflated surface option.
- Shading Type: Set the shading information for the surface
- N Vertices: This determines the resolution/quality of the rendering.
- Shading Min: Set the min greyscale value for the surface underlay (range of 0 to 1)
- Shading Max: Set the max greyscale value for the surface underlay (range of 0 to 1)
- Add Color Bar: Option to include/exclude colorbar from rendering.
- Round Values?: Rounds all values on the surface to nearest whole number. Useful for binary mask images.
- Nearest Neighbor?: Only the value from the closest voxel will be used. Useful for mask and label images.
- Dilate Inclusive Mask?: This will use spm_dilate to slightly dilate the suprathresholded image so that small or non-surface (e.g., sulcul) activations are visible.
Slice Montage
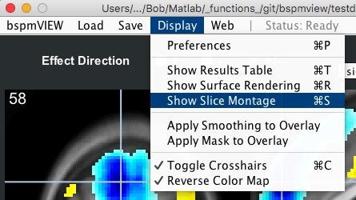
To visualize your thresholded map overlaid on a montage of anatomical slices, use the Slice Monagefunction, which you can find under Display in the Menu Bar:
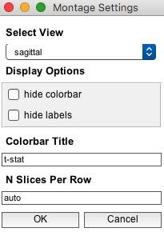
You should now see a pop-up menu that will allow you to select the slice view (sagittal, axial, coronal); hide either the color and/or the coordinate labels appearing on each slice; give the color (if not hidden) a snazzy title; and specify the maximum number of slices to include in each row of the montage:
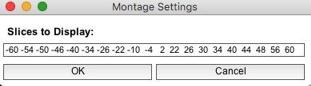
Pressing OK will advance you to the next challenge you will have to face: Choosing the slices to display. By default, bspmview automatically provides a representative list of slices containing local maxima in the thresholded image. Feel free to change, or just go with it knowing that you can easily delete individual slices from the resulting montage:
If it worked, you should see something approximating the mind-blowing work-of-art presented below:
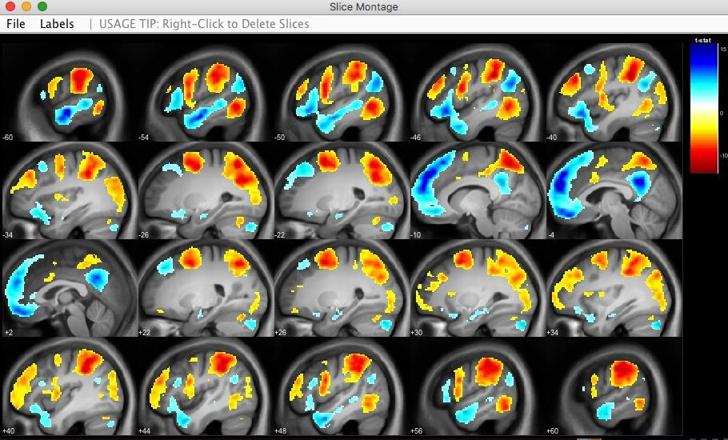
If there are too many slices, you can delete individual slices by right-clicking on any individual slice (when you do this, bspmview will try to automatically re-arrange the montage so it continues to look super hot). If chose to have labels, you can mess with the size and position of those using the - you guessed it - *Labels menu.